%matplotlib inline
import matplotlib.pyplot as plt
import numpy as np
from sklearn.datasets import make_circles
from sklearn.metrics.pairwise import rbf_kernel, polynomial_kernel
from sklearn.svm import SVC

RANDOM_SEED = 7
np.random.seed(RANDOM_SEED)
Kernels in Support Vector Machines
How kernel functions implicitly map observations into higher-dimensional spaces where linear separation becomes possible.
Setup
This notebook requires Python 3.11 and the packages below. Run this command in a notebook cell once if they are not already installed:
%pip install matplotlib==3.10.8 numpy==2.2.6 scikit-learn==1.7.2Restart the kernel after installation, then run the notebook from top to bottom.
Learning goals
By the end of this lesson, you should be able to:
- explain why some datasets cannot be separated by a hyperplane in the original feature space;
- define a feature map \(\phi\) and describe what it does geometrically;
- state the kernel trick and explain how it avoids computing \(\phi(\mathbf{x})\) explicitly;
- identify the RBF and polynomial kernels and describe their parameters; and
- write the kernel SVM decision function in terms of support vectors and the kernel.
Note
This lesson assumes familiarity with the SVM margin and dual formulation covered in the Support Vector Machines notebook.
1. When a linear classifier fails
A hyperplane in \(\mathbb{R}^d\) can correctly separate two classes only when they are linearly separable. Consider a binary dataset
\[ \mathcal{D}=\{(\mathbf{x}_i,y_i)\}_{i=1}^{N}, \qquad \mathbf{x}_i\in\mathbb{R}^d,\quad y_i\in\{-1,+1\}. \]
For a concentric-ring layout, the signed decision function \(f(\mathbf{x})=\operatorname{sign}(\mathbf{w}^\top\mathbf{x}+b)\) will misclassify some observations for every choice of \(\mathbf{w}\) and \(b\).
X, y = make_circles(n_samples=100, noise=0.10, factor=0.4, random_state=RANDOM_SEED)
y = 2 * y - 1  # map {0, 1} to {-1, +1}

xx, yy = np.meshgrid(np.linspace(-1.5, 1.5, 300), np.linspace(-1.5, 1.5, 300))
clf_lin = SVC(kernel='linear', C=1.0)
clf_lin.fit(X, y)
Z_lin = clf_lin.predict(np.c_[xx.ravel(), yy.ravel()]).reshape(xx.shape)

fig, axes = plt.subplots(1, 2, figsize=(12, 5))

ax = axes[0]
for lbl, color in [(-1, '#3157a4'), (1, '#e07a3f')]:
    ax.scatter(*X[y == lbl].T, c=color, label=f'y = {lbl}')
ax.set(xlabel='$x_1$', ylabel='$x_2$', title='Original feature space', aspect='equal')
ax.legend()

ax2 = axes[1]
ax2.contourf(xx, yy, Z_lin, alpha=0.15, cmap='coolwarm')
ax2.contour(xx, yy, Z_lin, colors='k', linewidths=0.8)
for lbl, color in [(-1, '#3157a4'), (1, '#e07a3f')]:
    ax2.scatter(*X[y == lbl].T, c=color, s=25)
acc_lin = (clf_lin.predict(X) == y).mean()
ax2.set(xlabel='$x_1$', ylabel='$x_2$',
        title=f'Linear SVM (train accuracy = {acc_lin:.0%})', aspect='equal')

plt.tight_layout()
plt.show()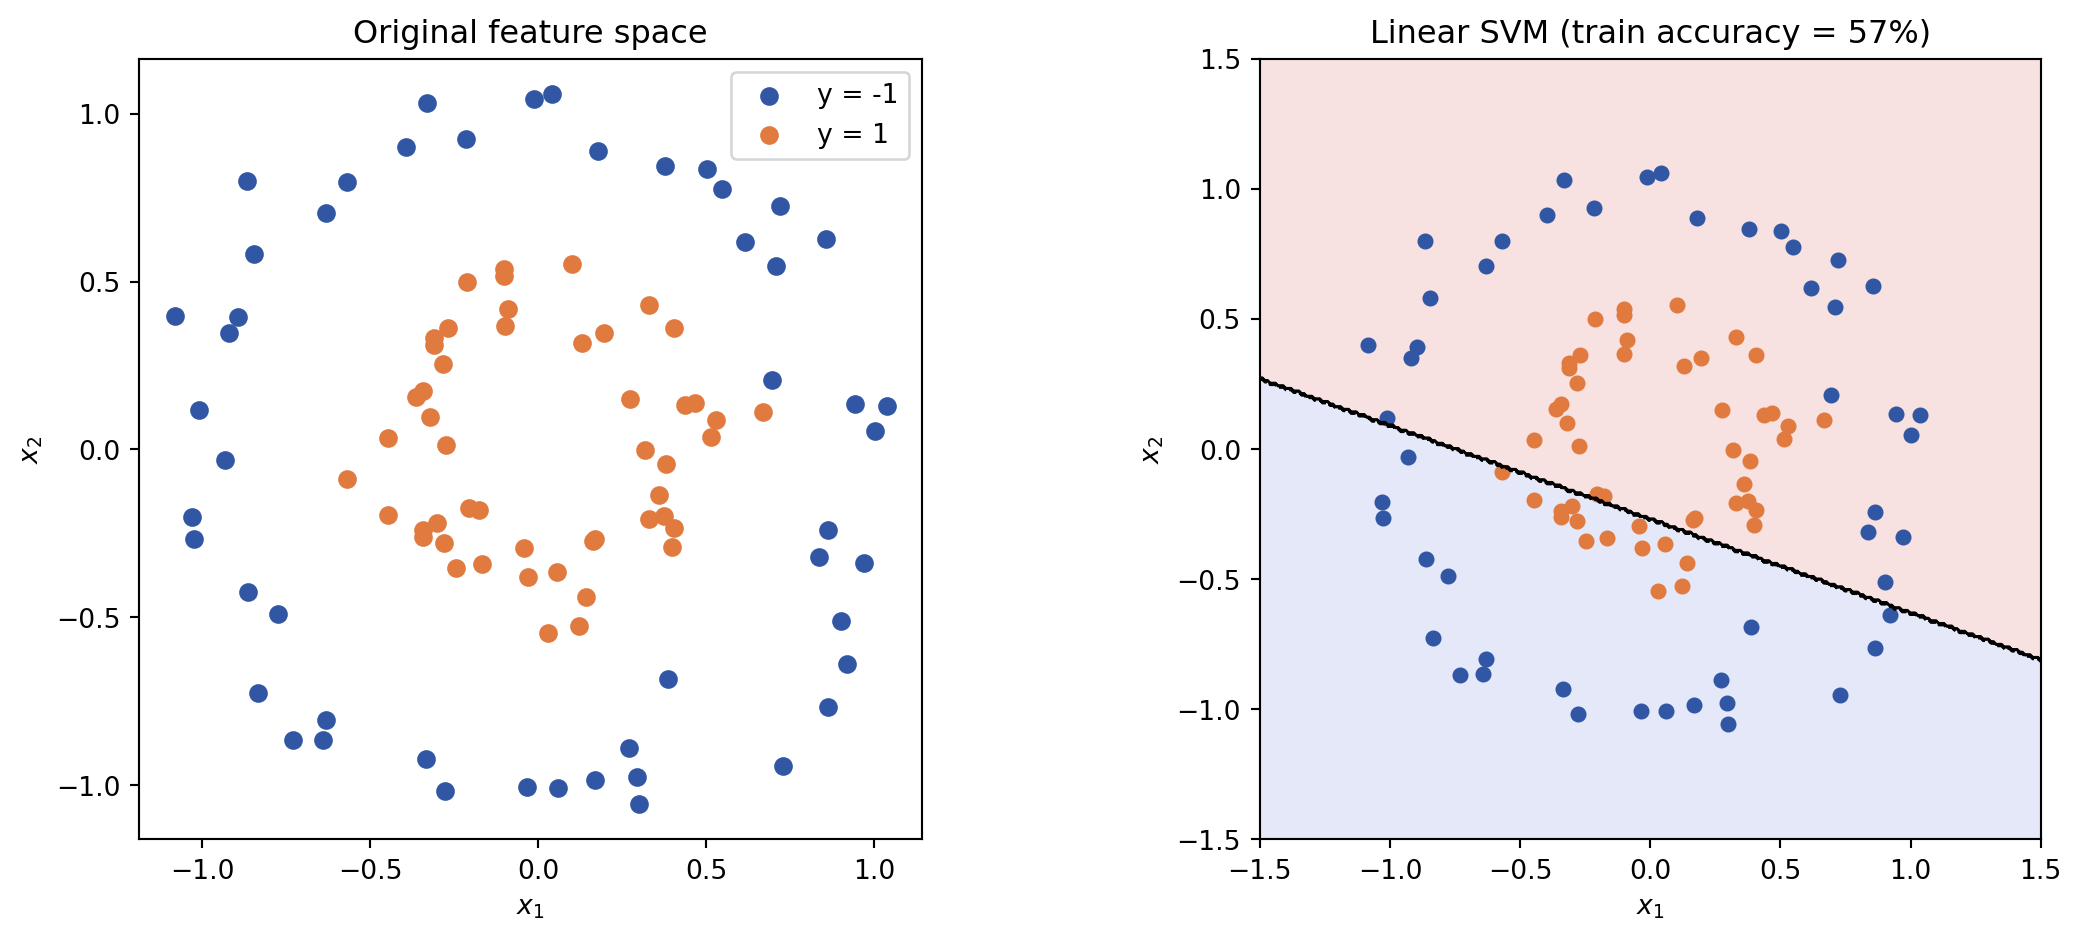
2. Feature maps
A feature map \(\phi\) lifts each observation from \(\mathbb{R}^d\) into a (possibly higher-dimensional) Hilbert space \(\mathcal{H}\):
\[ \phi:\mathbb{R}^d\to\mathcal{H}. \]
Choosing \(\phi\) so that the lifted observations are linearly separable allows the standard linear SVM to operate in \(\mathcal{H}\).
Example. For \(d=2\), define the degree-2 polynomial feature map
\[ \phi(x_1,x_2) =\bigl(x_1^2,\;\sqrt{2}\,x_1 x_2,\;x_2^2\bigr)\in\mathbb{R}^3. \]
After this lift, the two concentric rings become linearly separable by a plane in \(\mathbb{R}^3\).
def phi_poly2(Xin):
    u, v = Xin[:, 0], Xin[:, 1]
    return np.column_stack([u**2, np.sqrt(2) * u * v, v**2])

X_lifted = phi_poly2(X)

fig = plt.figure(figsize=(7, 5))
ax3d = fig.add_subplot(111, projection='3d')
for lbl, color in [(-1, '#3157a4'), (1, '#e07a3f')]:
    ax3d.scatter(*X_lifted[y == lbl].T, c=color, label=f'y = {lbl}', alpha=0.7)
ax3d.set_xlabel('x1**2')
ax3d.set_ylabel('sqrt2 * x1 * x2')
ax3d.set_zlabel('x2**2')
ax3d.set_title('Degree-2 polynomial feature space')
ax3d.legend()
plt.show()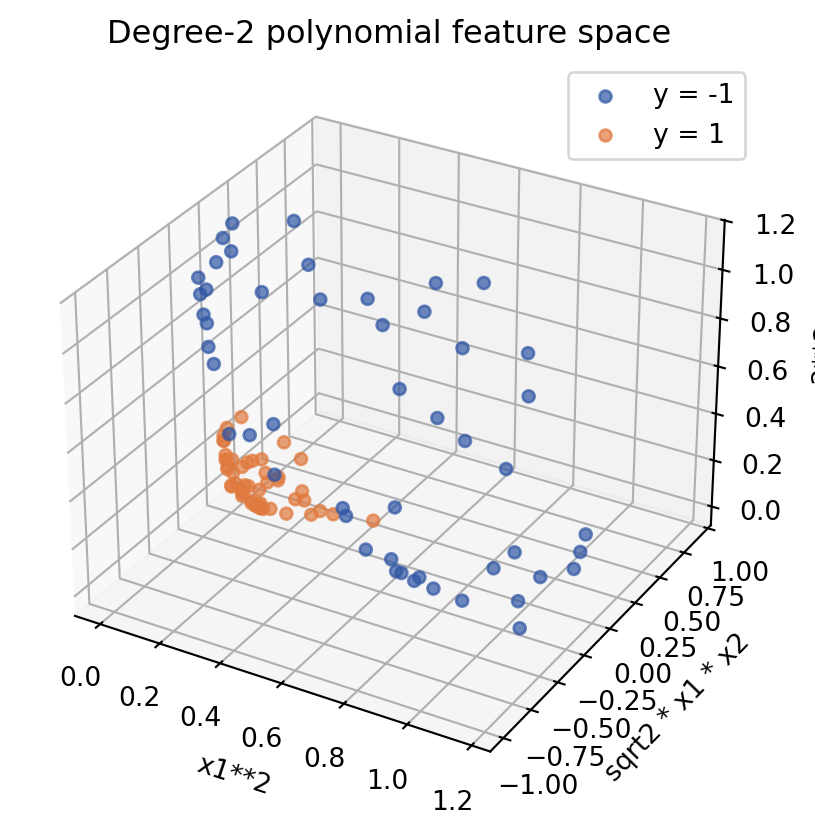
3. The kernel trick
Constructing \(\phi(\mathbf{x})\) explicitly can be expensive or impossible when \(\mathcal{H}\) is infinite-dimensional. The kernel trick observes that the SVM dual depends on \(\phi\) only through inner products \(\langle\phi(\mathbf{x}),\phi(\mathbf{z})\rangle_{\mathcal{H}}\).
A kernel function computes this inner product directly, without ever forming \(\phi\):
\[ k(\mathbf{x},\mathbf{z}) =\langle\phi(\mathbf{x}),\phi(\mathbf{z})\rangle_{\mathcal{H}}. \]
Two widely used kernels are:
| Kernel | Formula | Parameter |
|---|---|---|
| Polynomial | \(k_\mathrm{poly}(\mathbf{x},\mathbf{z})=(1+\mathbf{x}^\top\mathbf{z})^p\) | degree \(p\) |
| RBF (Gaussian) | \(k_\mathrm{RBF}(\mathbf{x},\mathbf{z})=\exp\!\left(-\gamma\lVert\mathbf{x}-\mathbf{z}\rVert^2\right)\) | bandwidth \(\gamma\) |
The RBF kernel corresponds to an infinite-dimensional feature space; \(k_\mathrm{RBF}\) is a simple closed-form expression that sidesteps the need to construct that space.
The matrix \(K\in\mathbb{R}^{N\times N}\) with entries \(K_{ij}=k(\mathbf{x}_i,\mathbf{x}_j)\) is the kernel matrix (also called the Gram matrix). It encodes all pairwise similarities needed by the SVM optimiser.
idx = np.argsort(y)
X_sorted = X[idx]

K_rbf  = rbf_kernel(X_sorted, gamma=1.0)
K_poly = polynomial_kernel(X_sorted, degree=2, coef0=1)
K_poly = K_poly / K_poly.max()  # normalise for display

fig, axes = plt.subplots(1, 2, figsize=(11, 4))
for ax, K, title in zip(
    axes,
    [K_rbf, K_poly],
    ['RBF kernel  (gamma = 1)', 'Polynomial kernel, degree 2 (normalised)'],
):
    img = ax.imshow(K, cmap='viridis', vmin=0, vmax=1)
    ax.set(xlabel='observation j', ylabel='observation i', title=title)
    fig.colorbar(img, ax=ax)
plt.tight_layout()
plt.show()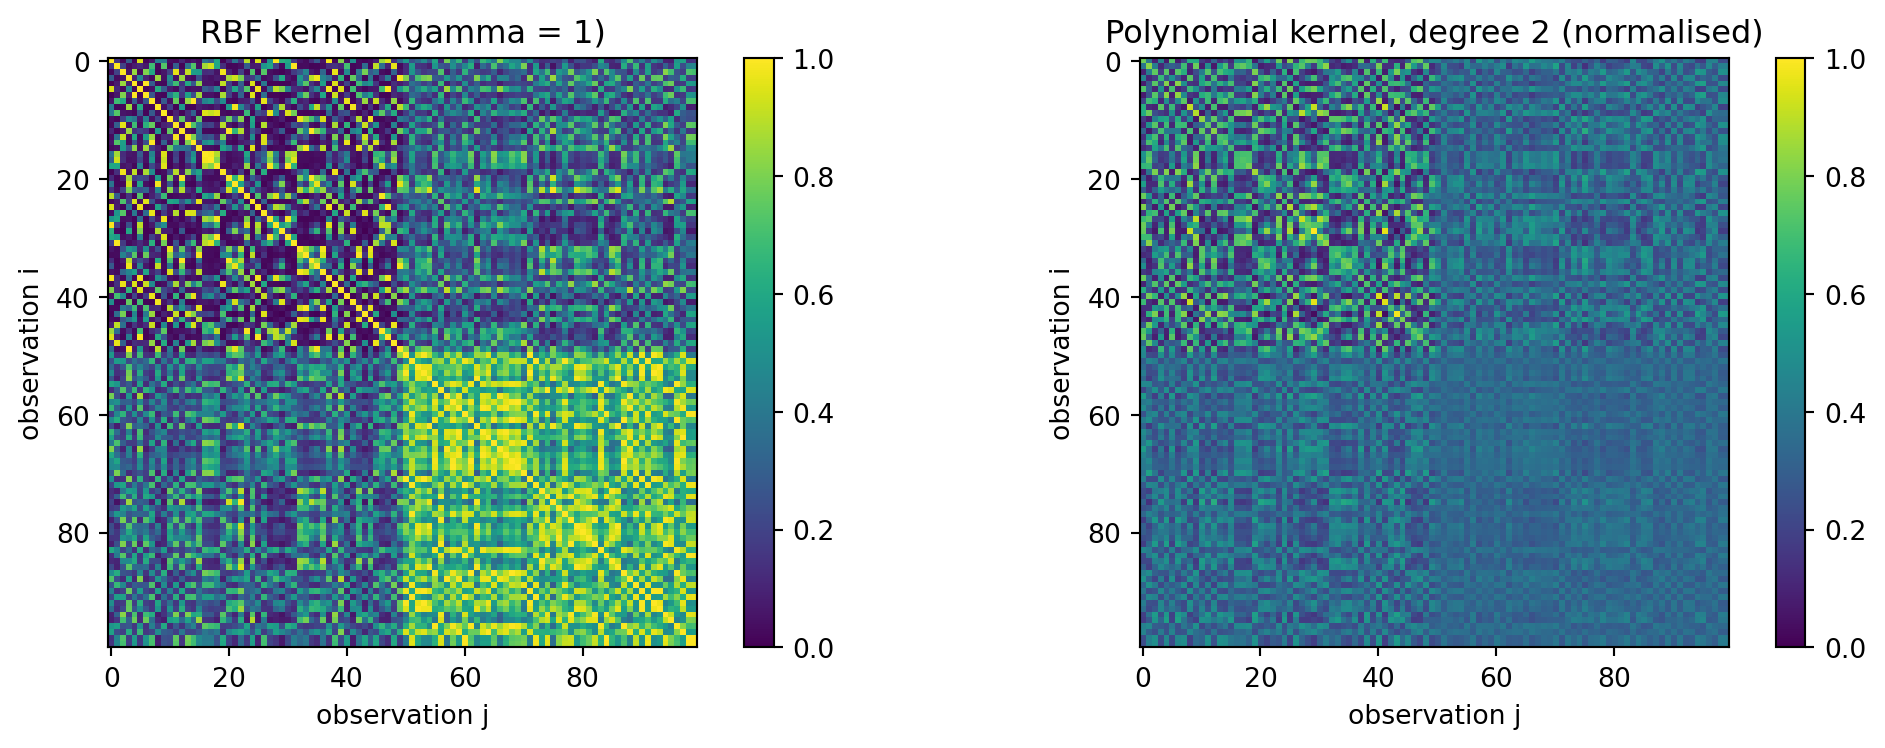
4. The kernel SVM decision function
Replacing \(\mathbf{x}_i^\top\mathbf{x}_j\) with \(k(\mathbf{x}_i,\mathbf{x}_j)\) in the SVM dual gives the kernel SVM dual:
\[ \max_{\boldsymbol{\alpha}}\;\sum_{i=1}^{N}\alpha_i -\frac{1}{2}\sum_{i=1}^{N}\sum_{j=1}^{N} \alpha_i\alpha_j y_i y_j\,k(\mathbf{x}_i,\mathbf{x}_j) \qquad\text{subject to}\quad \alpha_i\geq 0,\quad\sum_{i=1}^{N}\alpha_i y_i=0. \]
The optimisation is entirely classical regardless of whether \(k\) is a classical formula or a quantum circuit.
At prediction time, the decision function is
\[ f(\mathbf{x}) =\operatorname{sign}\!\left(\sum_{i\in\mathcal{S}}\alpha_i y_i\,k(\mathbf{x}_i,\mathbf{x})+b\right), \]
where \(\mathcal{S}=\{i:\alpha_i>0\}\) is the support-vector index set. Only support vectors contribute to classifying a new observation.
configs = [
    ('linear', {},                        'Linear'),
    ('poly',   {'degree': 2, 'coef0': 1}, 'Polynomial  (degree 2)'),
    ('rbf',    {'gamma': 1.0},            'RBF  (gamma = 1)'),
]

fig, axes = plt.subplots(1, 3, figsize=(14, 4))
for ax, (kernel, params, title) in zip(axes, configs):
    clf = SVC(kernel=kernel, C=1.0, **params)
    clf.fit(X, y)
    Z = clf.predict(np.c_[xx.ravel(), yy.ravel()]).reshape(xx.shape)

    ax.contourf(xx, yy, Z, alpha=0.15, cmap='coolwarm')
    ax.contour(xx, yy, Z, colors='k', linewidths=0.8)
    for lbl, color in [(-1, '#3157a4'), (1, '#e07a3f')]:
        ax.scatter(*X[y == lbl].T, c=color, s=25)
    ax.scatter(
        *X[clf.support_].T,
        s=100, facecolors='none', edgecolors='k', linewidths=1.2,
    )
    acc = (clf.predict(X) == y).mean()
    ax.set_title(f'{title}\n{len(clf.support_)} SVs  |  train acc = {acc:.0%}', fontsize=9)
    ax.set(xlabel='$x_1$', ylabel='$x_2$', aspect='equal')

plt.tight_layout()
plt.show()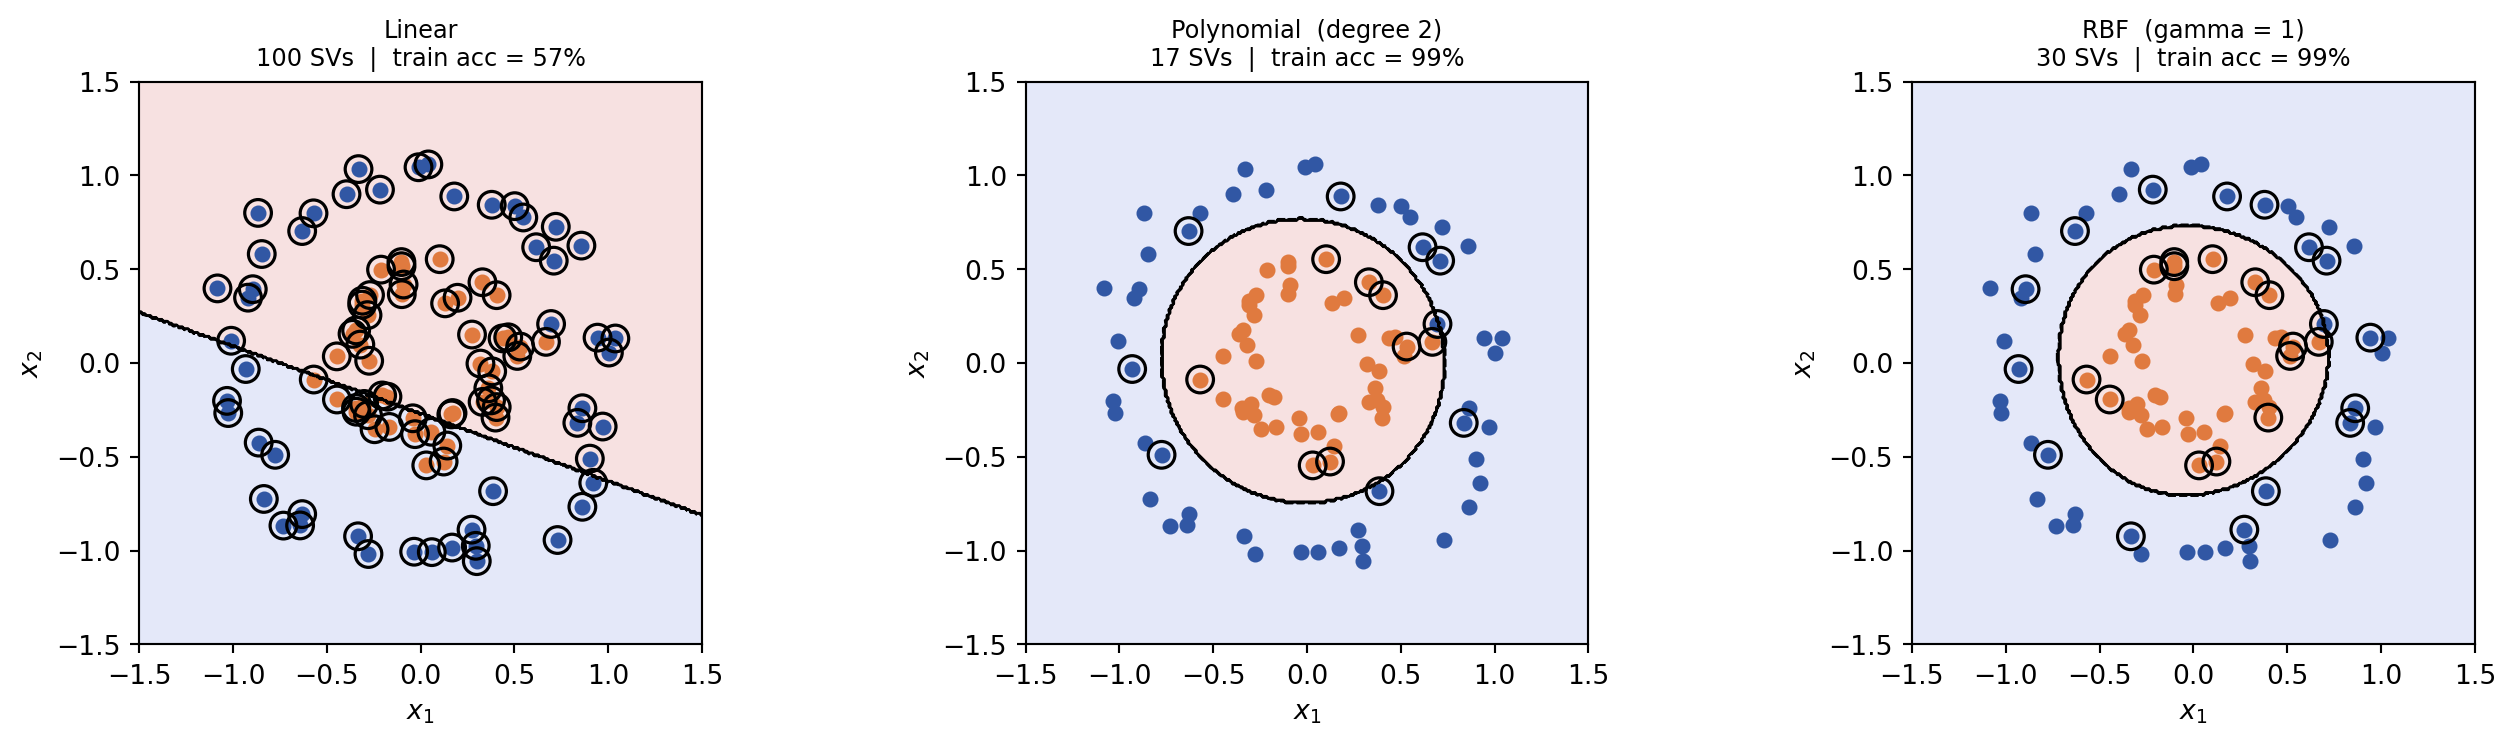
Try it yourself
- Change
RANDOM_SEEDand rerun. Does the number of support vectors for each kernel stay roughly the same? - Increase
noiseinmake_circlesto0.20. Which kernel degrades first? - Try
gamma = 0.1andgamma = 10for the RBF kernel. How does the decision boundary change? - Add a
sigmoidkernel to the comparison. What does the decision boundary look like?