Code
a <- 2
b <- 6
x <- seq(0, 8, length.out = 401)

plot(
  x, dunif(x, min = a, max = b), type = "l", lwd = 2,
  xlab = "x", ylab = "f(x)", main = "Uniform density on [2, 6]"
)
grid()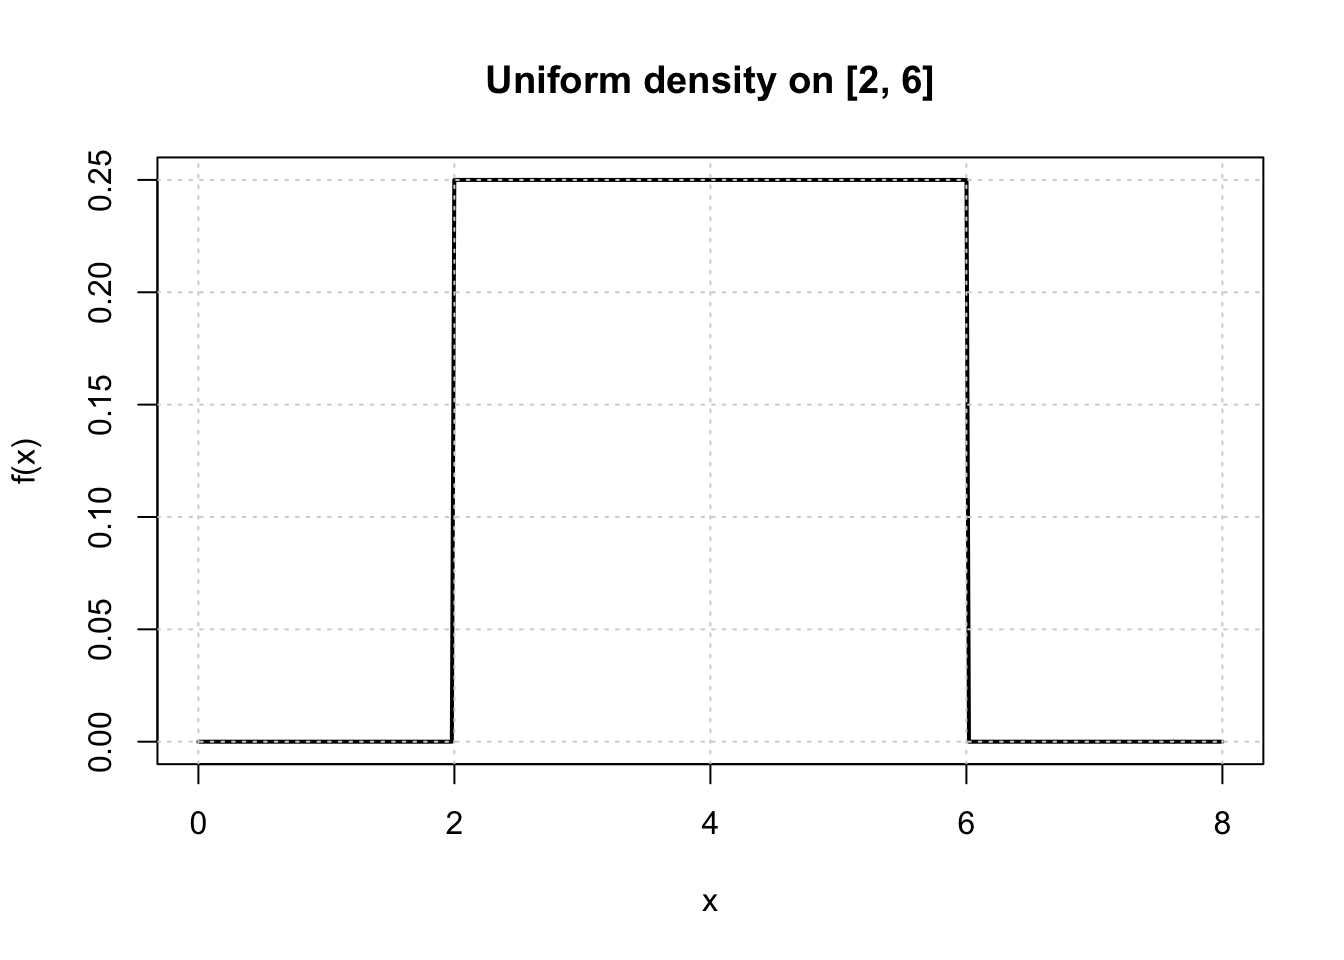

SD06 — Continuous Distributions
Course: Statistics and Probability for Data Science (DS14270).
Source deck: Samer El Kababji, SD06 — Continuous Distributions.
This lesson connects the continuous uniform distribution to simulation and Monte Carlo estimation. Computational experiments extend the deck and are labeled as such.
For \(X\sim U(a,b)\), every equal-length subinterval inside \([a,b]\) has the same probability. Its density is
\[ f(x)= \begin{cases} \dfrac{1}{b-a}, & a\leq x\leq b,\\[4pt] 0, & \text{otherwise}. \end{cases} \]
a <- 2
b <- 6
x <- seq(0, 8, length.out = 401)
plot(
x, dunif(x, min = a, max = b), type = "l", lwd = 2,
xlab = "x", ylab = "f(x)", main = "Uniform density on [2, 6]"
)
grid()
Inside the support,
\[ F(x)=P(X\leq x)=\frac{x-a}{b-a}. \]
For \(a\leq c\leq d\leq b\),
\[ P(c\leq X\leq d)=\frac{d-c}{b-a}. \]
Thus, for \(X\sim U(2,6)\),
\[ P(3\leq X\leq5)=\frac{5-3}{6-2}=0.5. \]
geometric_probability <- (5 - 3) / (6 - 2)
cdf_probability <- punif(5, 2, 6) - punif(3, 2, 6)

c(geometry = geometric_probability, R = cdf_probability)
geometry R
0.5 0.5 For continuous variables, including or excluding endpoints does not change the probability because \(P(X=x)=0\).
The center and spread are
\[ E(X)=\frac{a+b}{2},\qquad \operatorname{Var}(X)=\frac{(b-a)^2}{12}. \]
a <- 2
b <- 6

c(
  mean = (a + b) / 2,
  variance = (b - a)^2 / 12,
  sd = (b - a) / sqrt(12)
)
mean variance sd
4.000000 1.333333 1.154701 runif() generates pseudorandom uniform values. The following is a fictional simulation extending the deck.
set.seed(14270)
draws <- runif(100000, min = 2, max = 6)

c(
  simulated_mean = mean(draws),
  theoretical_mean = 4,
  simulated_variance = var(draws),
  theoretical_variance = 16 / 12,
  simulated_P_3_to_5 = mean(draws >= 3 & draws <= 5)
)
simulated_mean theoretical_mean simulated_variance
3.991902 4.000000 1.333947
theoretical_variance simulated_P_3_to_5
1.333333 0.500150 Draw a point \((X,Y)\) uniformly from the square \([-1,1]^2\). The square has area 4, while the unit circle inside it has area \(\pi\). Therefore,
\[ P(X^2+Y^2\leq1)=\frac{\pi}{4} \]
and a Monte Carlo estimator is
\[ \widehat\pi=4\left(\frac{\text{points inside the circle}}{n}\right). \]
set.seed(14270)
n <- 100000
x <- runif(n, -1, 1)
y <- runif(n, -1, 1)
inside <- x^2 + y^2 <= 1

pi_hat <- 4 * mean(inside)
c(estimate = pi_hat, truth = pi, error = pi_hat - pi)
estimate truth error
3.1412800000 3.1415926536 -0.0003126536 keep <- seq_len(2500)
plot(
x[keep], y[keep], pch = 19, cex = 0.45,
col = ifelse(inside[keep], "steelblue", "tomato"),
asp = 1, xlab = "X", ylab = "Y", main = "Monte Carlo points"
)
symbols(0, 0, circles = 1, inches = FALSE, add = TRUE, lwd = 2)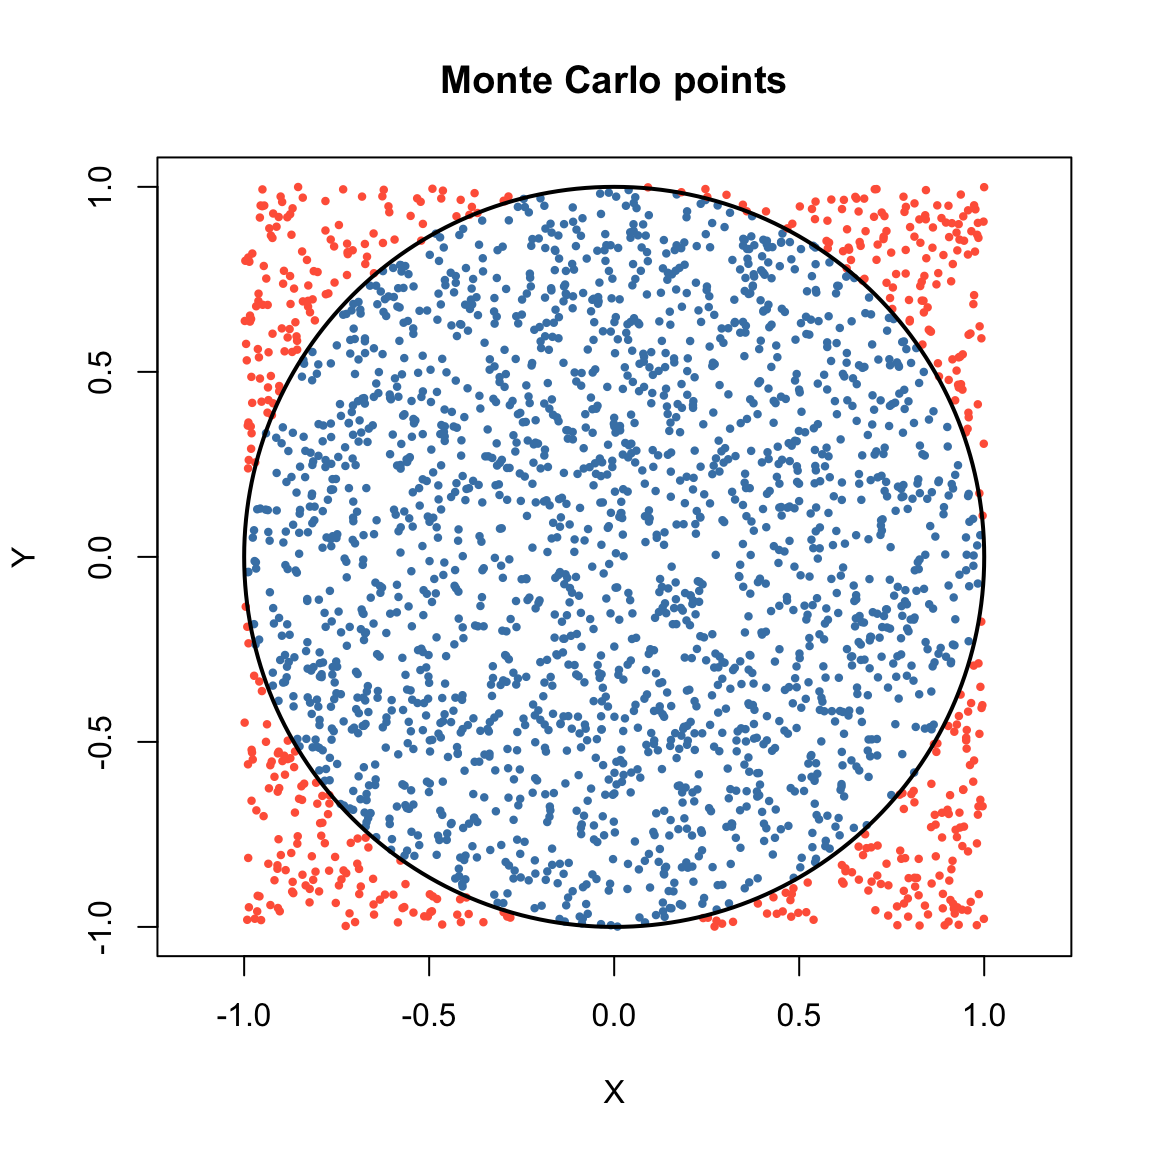
qunif() to find the 90th percentile.qunif(0.90, 10, 18) gives \(17.2\).