Course: Statistics and Probability for Data Science (DS14270).Source deck: Samer El Kababji, SD06 — Continuous Distributions .
The Weibull distribution is a flexible model for lifetimes and survival. In this lesson, \(k\) is the shape and \(\lambda\) is the scale , matching the deck and base R.
Density, CDF, and survival function
For \(X\sim\operatorname{Weibull}(k,\lambda)\) ,
\[
f(x)=\frac{k}{\lambda}
\left(\frac{x}{\lambda}\right)^{k-1}
\exp\left[-\left(\frac{x}{\lambda}\right)^k\right],
\qquad x\geq0,
\]
and
\[
F(x)=1-\exp\left[-\left(\frac{x}{\lambda}\right)^k\right].
\]
Therefore the survival function is
\[
S(x)=P(X>x)=\exp\left[-\left(\frac{x}{\lambda}\right)^k\right].
\]
Code
<- 2 <- 100 <- c (0 , 40 , 80 , 120 )data.frame (density = dweibull (x, shape = shape, scale = scale),CDF = pweibull (x, shape = shape, scale = scale),survival = pweibull (shape = shape, scale = scale, lower.tail = FALSE
    x     density       CDF  survival
1   0 0.000000000 0.0000000 1.0000000
2  40 0.006817150 0.1478562 0.8521438
3  80 0.008436679 0.4727076 0.5272924
4 120 0.005686266 0.7630722 0.2369278
Component-lifetime example
For shape \(k=2\) and scale \(\lambda=100\) ,
\[
P(X<80)=1-\exp[-(80/100)^2]\approx0.4727.
\]
Code
c (formula = 1 - exp (- (80 / 100 )^ 2 ),R = pweibull (80 , shape = 2 , scale = 100 )
  formula         R
0.4727076 0.4727076
Mean and variance
The moments use the gamma function:
\[
E(X)=\lambda\Gamma\left(1+\frac1k\right),
\]
\[
\operatorname{Var}(X)=\lambda^2\left[
\Gamma\left(1+\frac2k\right)-
\Gamma\left(1+\frac1k\right)^2
\right].
\]
Code
<- 2 <- 100 <- lambda * gamma (1 + 1 / k)<- lambda^ 2 * (gamma (1 + 2 / k) - gamma (1 + 1 / k)^ 2 c (mean = mu, variance = variance, sd = sqrt (variance))
      mean   variance         sd
  88.62269 2146.01837   46.32514
Shape and failure behavior
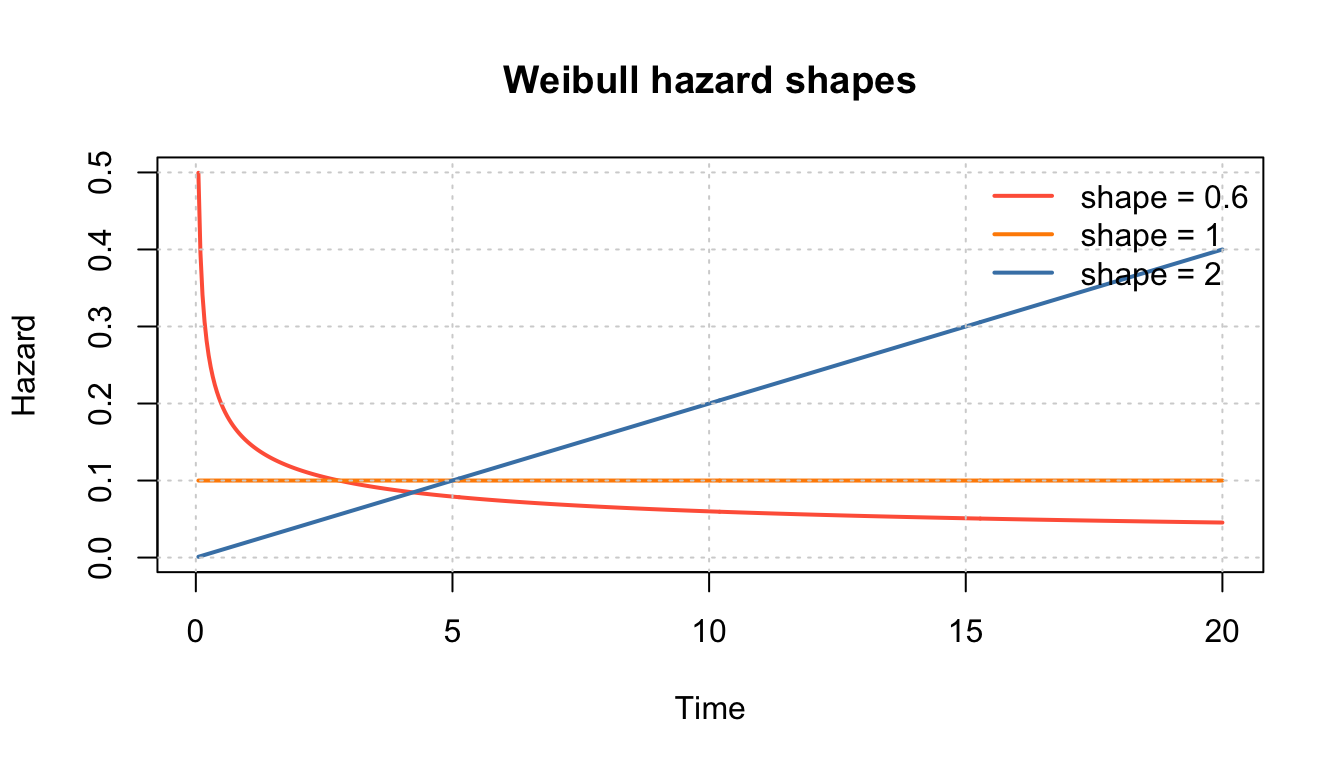
The Weibull hazard function is
\[
h(x)=\frac{f(x)}{S(x)}
=\frac{k}{\lambda}\left(\frac{x}{\lambda}\right)^{k-1}.
\]
\(k<1\) : decreasing hazard, often associated with early failures.\(k=1\) : constant hazard; the Weibull becomes exponential.\(k>1\) : increasing hazard, often associated with wear-out.
Code
<- seq (0.05 , 20 , length.out = 500 )<- c (0.6 , 1 , 2 )<- c ("tomato" , "darkorange" , "steelblue" )matplot (sapply (shapes, function (k) (k / 10 ) * (x / 10 )^ (k - 1 )),type = "l" , lty = 1 , lwd = 2 , col = colors,xlab = "Time" , ylab = "Hazard" , main = "Weibull hazard shapes" legend ("topright" , legend = paste ("shape =" , shapes), col = colors,lty = 1 , lwd = 2 , bty = "n" )grid ()
Scale changes the time axis
For fixed shape, a larger scale stretches lifetimes. Because
\[
F(\lambda)=1-e^{-1}\approx0.632,
\]
the scale is the time by which about 63.2% of the population has experienced the event.
The deck’s survival context uses shape 2 and scale 12 months.
Code
<- c (6 , 12 , 18 , 24 )data.frame (months = times,survival_probability = pweibull (shape = 2 , scale = 12 , lower.tail = FALSE
  months survival_probability
1      6           0.77880078
2     12           0.36787944
3     18           0.10539922
4     24           0.01831564
These are model-based probabilities, not patient predictions.
Practice questions
For shape 1.5 and scale 20, find \(P(X\leq10)\) .
Find \(P(X>25)\) .
Is the hazard increasing or decreasing?
What special distribution results when the shape is 1?
pweibull(10, 1.5, 20) gives approximately \(0.2978\) .pweibull(25, 1.5, 20, lower.tail = FALSE) gives approximately \(0.2472\) .It is increasing because \(k=1.5>1\) .
An exponential distribution with rate \(1/\lambda\) .